Quick Answer
In one sentence: You don't have to guess whether your neighborhood has a burglary problem, because the property crime figures for your specific address are free and public, and the signs worth trusting are the ones you can verify rather than the ones you feel.
The longer answer: Most articles on this topic ask you to read atmosphere. That's unreliable, and it pushes people toward judging neighbors rather than assessing risk. A better approach has three parts: look up the actual property crime data for your area, learn to read it properly so you don't draw the wrong conclusion, and then check the environmental factors that criminology research has genuinely linked to burglary risk. This guide covers all three, including the honest limits of what crime statistics can tell you.
Key Takeaways
- Property crime data for your address is free through the FBI Crime Data Explorer, local police dashboards, and city open data portals.
- Compare rates per resident rather than raw counts, or a dense area will always look worse than it is.
- Look at a five-year trend, since a single bad season distorts the picture.
- Research indicates homes that look occupied, and homes near occupied homes, carry lower burglary risk.
- Crime statistics depend on incidents being reported and forwarded, so they undercount rather than overcount.
Most versions of this article ask you to notice a mood. Does the street feel wrong, are there unfamiliar cars, does something seem off. That approach has two problems: it isn't evidence, and it quietly encourages people to judge their neighbors by appearance. Neither makes your home safer. What follows is the version built on things you can check. If you've read how burglars choose which homes to target, this is the same question widened from your house to your street.
Start With the Data, Not the Feeling
Before anything else, spend twenty minutes finding out what actually happens in your area. Three sources cover it, and all are free.
Your local police department
Many departments publish crime dashboards or mapping tools searchable by address or neighborhood, often updated weekly, alongside annual crime reports. This is the most granular view you'll get and the best place to start.
Your city or county open data portal
Many municipalities publish incident-level data, sometimes daily. It's less polished than a police dashboard but frequently more detailed.
The FBI Crime Data Explorer
The national standard, compiling reports from thousands of law enforcement agencies. It's best for state and city-level trends and for comparing your area against a wider baseline rather than for street-level detail. Visit the FBI Crime Data Explorer.
Third-party crime mapping apps also exist and are convenient, but most repackage the same official reports, so treat them as a quicker view of the same underlying data rather than an independent source.

The Seven Signs
Four you look up, three you can observe without judging anyone.
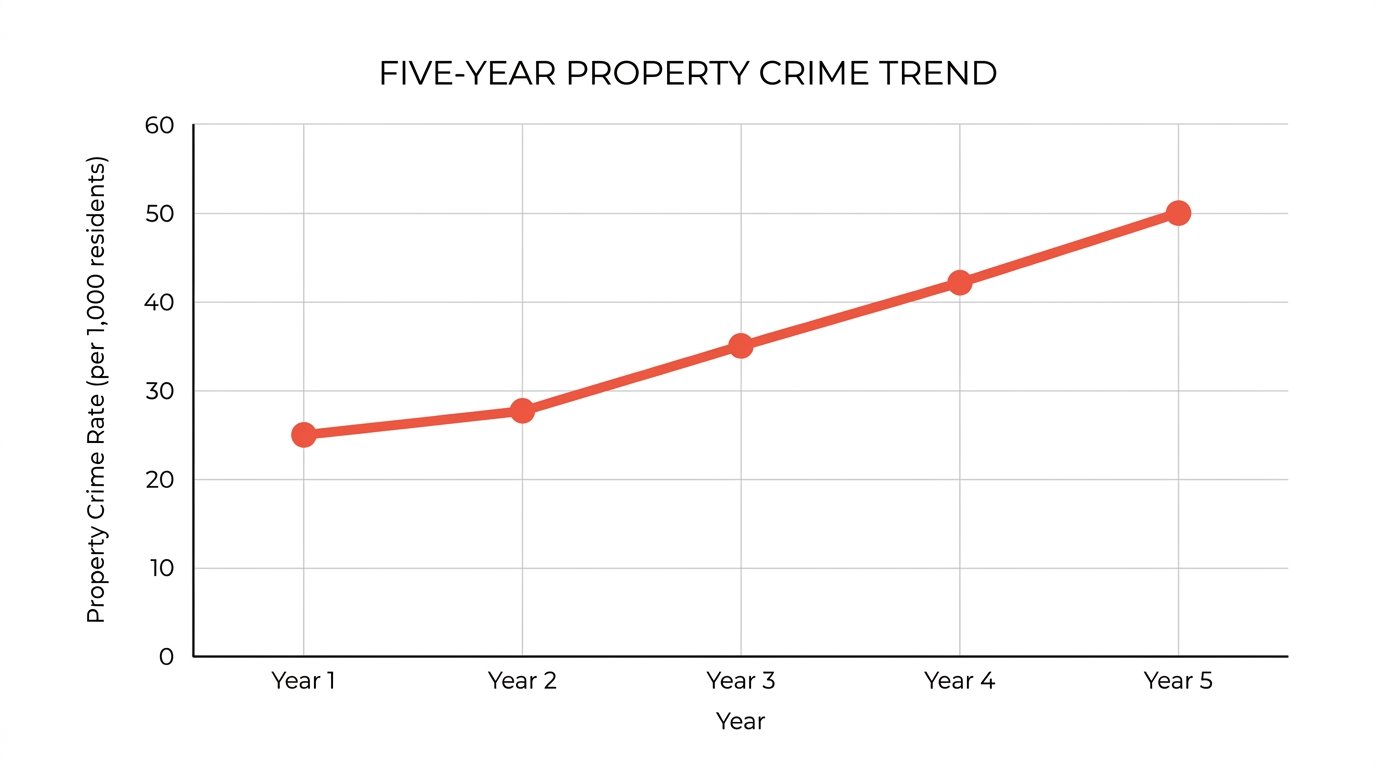
1. Property crime is trending up over five years
A single bad year means little. A rate climbing steadily across five years is a real signal. Pull the property crime figures specifically, since violent crime trends answer a different question.
2. Burglaries cluster near you rather than spread thin
On a crime map, look at concentration rather than the total. A handful of incidents grouped within a few streets of you matters far more to your risk than a larger number scattered across a wide area.
3. The local clearance rate is low
Clearance rate is the share of reported crimes that get resolved. Analysts note that a low rate can indicate under-resourced policing, which is a risk signal even when incident totals look stable. Many annual reports publish it.
4. Your area's rate is high relative to comparable places
Compare against similar neighborhoods rather than a national average. Density, foot traffic, and proximity to nightlife all raise reported incident counts for reasons that have little to do with your street.
5. Many homes on the street look empty during the day
This one has solid research behind it. Work published by the Arizona State University Center for Problem-Oriented Policing notes that homes appearing occupied, with lights on, a vehicle present, or visible activity, are less likely to be burglarized, and that even homes near occupied homes carry lower risk. A street that empties out entirely on weekdays is a genuinely different risk profile from one with people around.
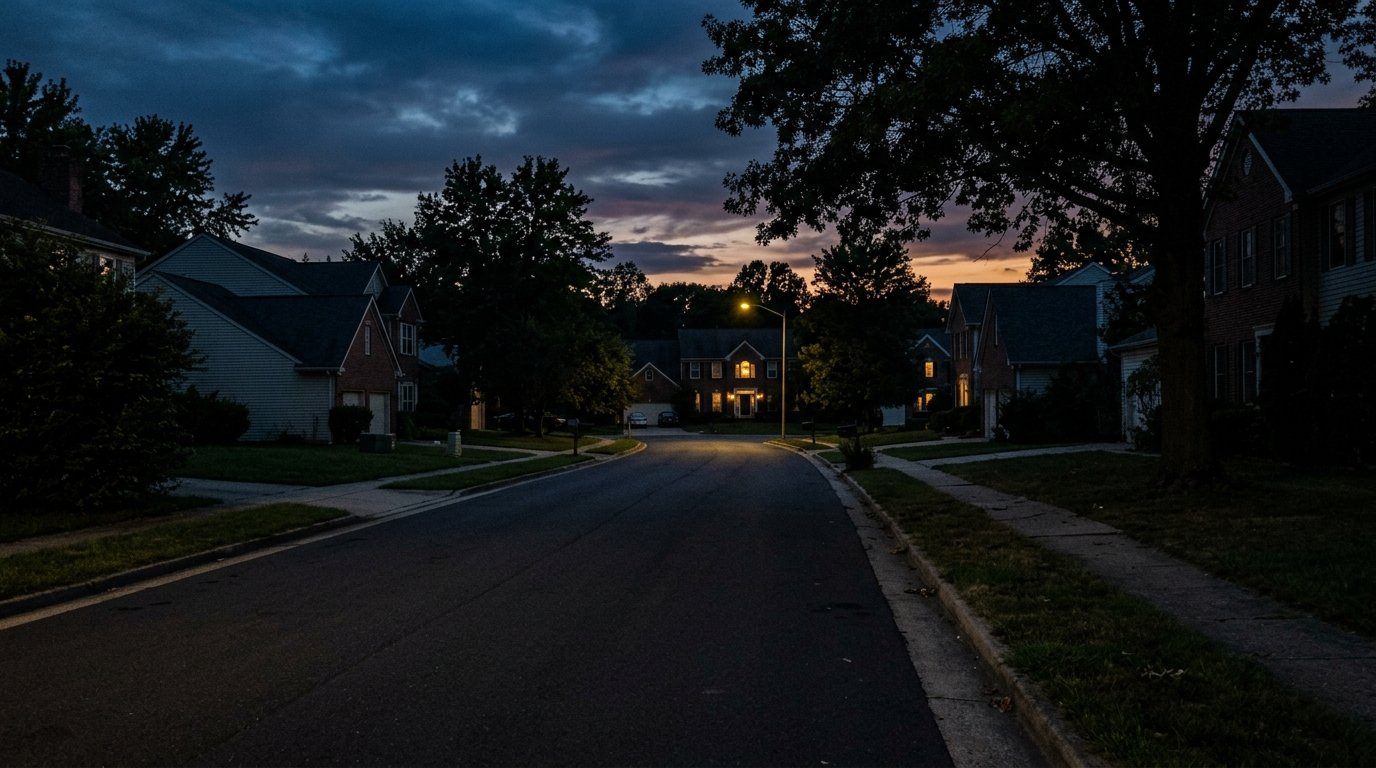
6. Poor lighting and low foot traffic
Neighborhood safety analysis consistently points to street lighting and pedestrian activity as protective factors. Bright lighting reduces hiding places, and steady foot traffic means more people who would notice something unusual. Dark stretches with nobody walking are the opposite.
7. Few visible security measures on the street
This works at the block level, not just the individual home. University of North Carolina survey research found around 60 percent of burglars said they would avoid a home with a visible security system, and an Urban Institute review found crime fell roughly 15 to 20 percent in neighborhoods where surveillance networks were installed. A street where almost nothing is visible offers less friction overall.
Concerned about what you found?
Our advisors can talk through what actually fits your situation, without pushing you toward more equipment than you need. Free consultation, no pressure.
Call (855) 248-8052 or request a free quote online.How to Read Crime Data Without Fooling Yourself
Crime figures are easy to misread in both directions. Four rules keep you honest.
| Rule | Why | Common mistake |
|---|---|---|
| Use rates, not raw counts | Rate per resident allows a fair comparison between areas | Assuming a dense area is dangerous because totals are higher |
| Look at five years | One bad season distorts a short window | Reacting to a single month or a recent local story |
| Separate property from violent crime | They answer different questions | Judging burglary risk from an overall crime score |
| Check concentration, not just volume | Proximity matters more than the citywide figure | Seeing many dots on a map without checking where they sit |
What the Data Will Not Tell You
This part gets left out of most security content, and it matters if you want an accurate picture rather than a scary one.
Statistics only count what gets reported. Neighborhood safety analysis notes that crime figures depend both on residents reporting incidents and on agencies forwarding them to federal collections. Not everything is reported, so official numbers generally undercount rather than overcount.
Reporting rates differ between areas. Two neighborhoods with identical actual crime can produce different official figures if residents in one report more consistently. That makes comparisons directionally useful rather than precise.
The protective factors are largely invisible in the data. Things that make a street safer, such as neighbors who know each other and notice unfamiliar activity, do not appear in municipal reports at all. A neighborhood can look average on paper and be well protected in practice.
So treat the data as one input rather than a verdict, and be careful about drawing conclusions about people from it. Numbers describe incidents. They do not describe your neighbors.
What Actually Reduces Risk on Your Street
If several signs apply to you, the useful response is not alarm. It's the small set of things with evidence behind them.
- Make your home look occupied. Varied interior lighting on timers, a vehicle present where possible, and no accumulated mail or packages.
- Make security visible. Survey research indicates most burglars avoid homes where they can see a system, so visibility does the work.
- Light the approaches. Motion-activated exterior lighting removes the dark spots near doors and windows.
- Cover entry points before anything else. Doors and accessible ground-floor windows carry most of the risk.
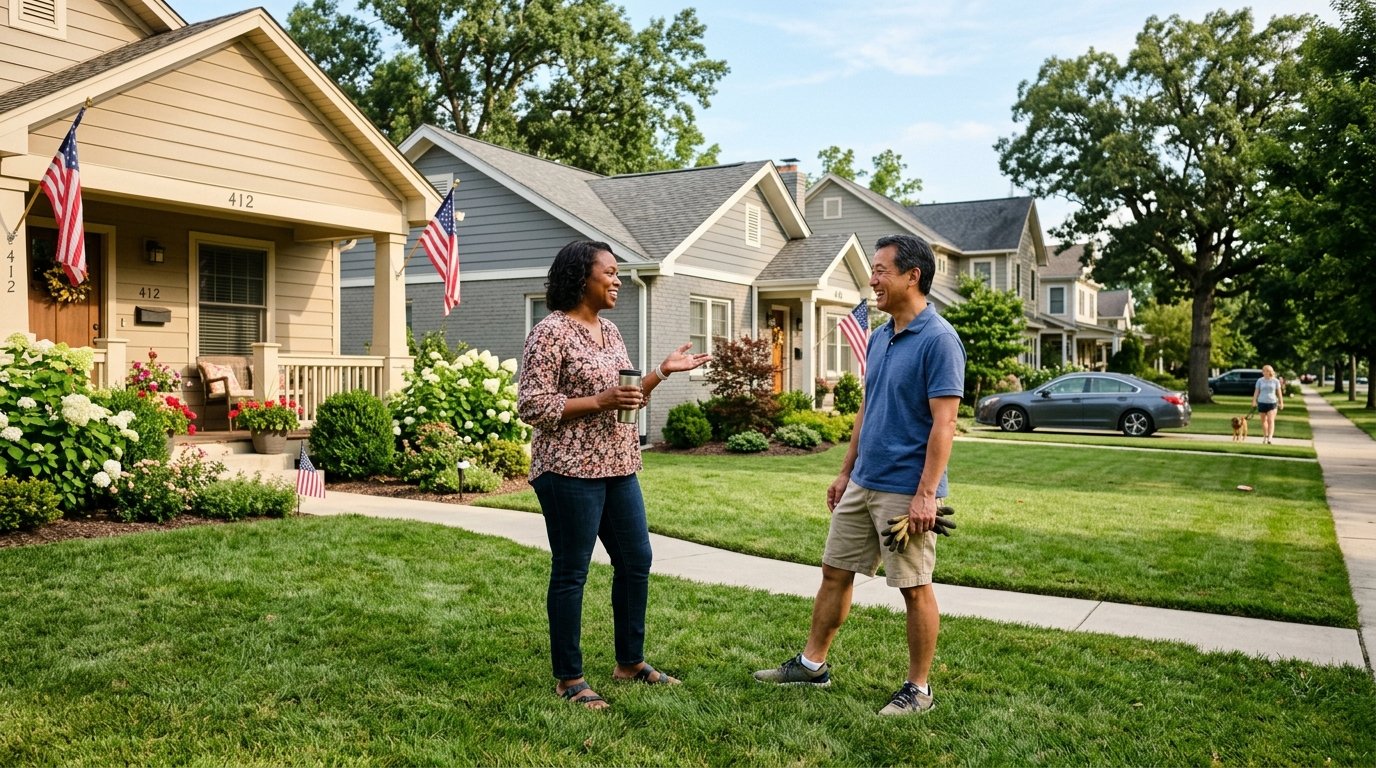
- Get to know two neighbors. Someone who notices an unfamiliar van in your driveway is worth more than another camera, and it costs nothing.
Deterrence beats detection. The aim is to be passed over, not to have good footage of the person who chose you.
If you're adding cameras, our guides to camera placement and whether you need a system at all cover the specifics without assuming you need to buy everything at once.
Frequently Asked Questions
How do I check the crime rate in my neighborhood?
Start with your local police department's crime dashboard, which is often searchable by address. Add your city's open data portal for incident detail, and the FBI Crime Data Explorer for wider trends. All three are free.
What is the most reliable sign of a neighborhood burglary problem?
A property crime rate rising steadily across five years, combined with incidents clustering near your address. Single-year figures and citywide totals are both easy to misread, so the trend and the concentration matter most.
Should I compare my neighborhood to the national average?
Compare against similar neighborhoods instead. Density, foot traffic, and proximity to nightlife all raise reported incident counts for reasons unrelated to your street, so national averages produce misleading comparisons.
Does street lighting actually reduce burglary?
Neighborhood safety analysis consistently treats lighting as protective, since it reduces hiding places and supports foot traffic. It works best combined with other factors rather than as a single fix on its own.
Why do crime statistics undercount crime?
Because they depend on residents reporting incidents and agencies forwarding them to federal collections. Not every incident is reported, so official figures generally sit below actual crime levels rather than above them.
Do visible security systems help the whole street?
Evidence suggests some spillover. Survey research found most burglars avoid homes with visible systems, and one review found crime fell roughly 15 to 20 percent in neighborhoods where surveillance networks were installed.
Is a low clearance rate something to worry about?
It can be. Clearance rate is the share of reported crimes resolved, and analysts note a low rate may indicate under-resourced policing. That's a meaningful signal even when incident totals appear stable.
What if my neighborhood looks fine but I still feel uneasy?
That's worth taking seriously, since protective factors and risks both sit partly outside official data. Focus on the measures with evidence behind them: occupied appearance, visible security, lighting, and covered entry points.
Does a burglary nearby mean I'm likely to be targeted?
Not necessarily, though proximity matters more than citywide figures. Research also indicates previously burglarized properties and their neighbors face elevated short-term risk, so it's a reasonable prompt to review your own setup.
Can I use crime data to judge whether to move somewhere?
It's one useful input among several. Read rates rather than counts, look at multi-year trends, and remember that reporting rates differ between areas, which makes comparisons directional rather than precise.
Related Reading
- How Do Burglars Actually Choose Which Homes to Break Into?
- Home Security Camera Placement: The Spots That Actually Matter
- Do You Actually Need a Home Security System?
- Home Security Tips When You're Traveling for the Holidays
Explore our services:
Get a Second Opinion, Free
Knowing your actual risk is more useful than worrying about it, and it usually leads to a smaller, cheaper response than people expect.
Home Secure Connect is an independent home security advisor. We help homeowners across the USA work out what their situation actually calls for, then compare options across our trusted provider partners. Free consultation. No obligation. No pressure.
Call (855) 248-8052 or Request a Free QuoteAvailable Mon to Fri, 10am to 8pm ET.
Trending This Week
Smart Locks vs Traditional Deadbolts: Which Actua…
September 23, 2026 · About 8 min read
Alarm System vs Security System: What's the Diffe…
September 21, 2026 · About 8 min read
Home Security for Aging Parents: Practical Advice…
September 16, 2026 · About 9 min read